Warm-up
To ensure system stability, allow a 5 minute warm-up period prior to calibration data collection.
Sphere deployment
Douse (or soak) the sphere with liquid soap to prevent adherence of bubbles to the target.
Towed body
A fishing pole is the most convenient tool for the calibration of a towed transducer. The calibration sphere cradle is tied to the loose end of the fishing pole line and lowered in to the beam. One challenge with this method is keeping the sphere stationary when performing the on-axis calibration. If a mounting bracket, that would allow the sphere to be position near the acoustic axis, is available, higher quality data can be collected.
An alternative approach, commonly used for small-boat deployments, is to keep the sphere stationary but to move the transducer relative to the sphere. When using this technique, care must be taken to avoid introducing bubble noise at the transducer face.
Hull mounted
Few ships have hull-mounted transducers in the Great Lakes. For such calibrations, it is necessary to construct a 3-point calibration system (Fig. 13). Foote et al. (1987) describe this method in detail.
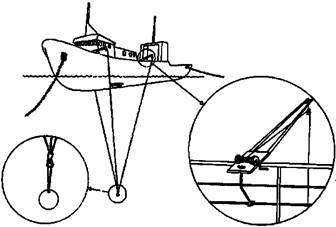
Figure 13. Hull-mounted sphere deployment. From Foote et al. (1987)
On-axis calibration
On-axis sensitivity is measured by positioning the calibration sphere on the acoustic axis of the transducer. The TS gain is derived from the measured on-axis TS relative to the known TS of the calibration sphere. Similarly, SV gain is also calibrated by measuring SV relative to the theoretical value. Measure Sa values for the whole target, as SV values also depend on the size of the region around the ball (calculated as averages including depth with no ball targets). Theoretical Sa is based on the TS and range to the calibration sphere. With the target in the middle of the beam, theoretical Sa can be calculated from
 |
|
[21] |
To perform an on-axis calibration for either towed or hull-mounted transducers:
- Note the temperature, echosounder, pulse length and ping rate (fast ping rate is fine, e.g., 5 pps) on your calibration sheet.
- With Simrad units, use the single target detection window or the oscilloscope to center the sphere on the acoustic axis (Fig. 14). With Biosonics units, observe the oscilloscope display of angle data on the computer screen and center the ball by minimizing both angles. This should maximize the voltage return.
- Begin recording data and note the time.
- Watch that the sphere remains in the center of the beam most of the time (Fig. 14). Do not adjust the vertical location of the sphere. If the sphere moves, and stays, off axis, begin at Step 1 in the new position.
- Collect data for approximately 5-10 minutes.
- Note time when stopped recording, make any changes (for example another pulse length) and start again at Step 1.
It is possible to isolate on axis data during post-processing to obtain on axis values for both Sv and TS calibrations. For on-axis calibrations, Echoview may be used during analysis (or live viewing) to filter targets within a desired on-axis tolerance.
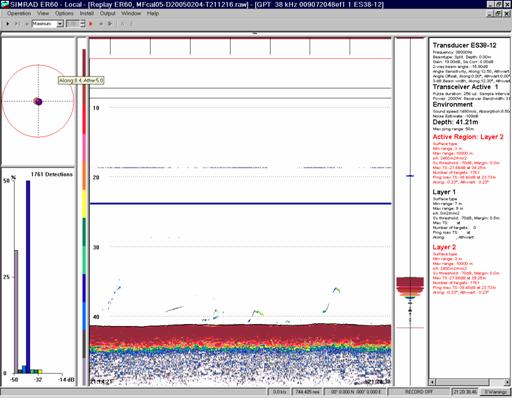
Figure 14. Simrad ER60 software showing the calibration sphere near the center of the acoustic axis.
Beam pattern measurement
Beam pattern measurements are acquired by positioning the calibration sphere at many different angular locations within the acoustic beam. For split-beam transducers, echo strength is compensated by the angular location of the target in the acoustic beam.
Some manufacturers provide software to collect beam pattern measurements (Fig. 15), but the results from these programs are not universally accepted/applied by acoustic users (see Known Issues). Simrad recommends a minimum of 100 pings per quadrant for a good beam pattern measurement, with many hits registered near the acoustic axis.
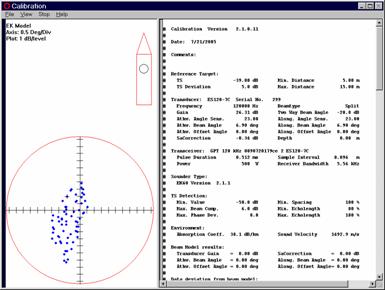
Figure 15. Screen capture from the Simrad Lobes program, showing measurements of the calibration sphere in the beam. The coverage of the beam would not be considered adequate in this instance.