Noise
Many types of noise can be eliminated during data collection or post-processing. Noise removal during data collection is preferable. Noise that cannot be removed will increase Sv measurements and bias in situ TS measurements, leading to errors in fish density or biomass estimates. Collect passive data during regular operating conditions to record the noise levels present during the survey (see below).
Some instruments output noise levels at 1 m depth and this should be recorded. We recommend that authors report the noise levels or the SNR at the deepest depth included in the analyses. Remember that noise levels at 1 m are different if expressed as TSu or Sv data. This is because Sv values include a term for the equivalent beam angle and sampling volume whereas uncompensated target strength (TSu) values do not (compare Equations 3 and 6). Therefore, the difference between TSu and Sv data is depth dependent. Note that TS refer to the target strength of the fish and TSu refer to the measure of echo level with a 40 log R TVG function, also sometimes called non-adjusted TS. This distinction is important and not clear in some existing software. From combining Equations 6 and 12, we get:
 |
|
[24] |
Noise Level Example .
A noise level measured in the Sv domain as -120 dB at 1 m depth (with a 120 kHz, 7.8º transducer and therefore a Ψ of –20.4 dB, a sound speed of 1450 m•s-1, and a pulse duration of 0.4 ms) is -146 dB in the TS domain at 1m (20 log (1) = 0)
(See Noise Level for more details..)
Acoustic noise
A common type of acoustic noise is a discreet spike caused by another echosounder or sonar operating within the frequency bandwidth or a harmonic of the scientific echosounder (Fig. 22 - Fig. 23). The solution is to identify the source of the interference and shut it down. Interference can be eliminated if acoustical instrumentation essential for safe ship operation is synchronized with the survey echosounder. Removal of acoustic noise during post-processing is sometimes possible, but difficult, so eliminating it during the survey is always preferable (NMFS SOP).
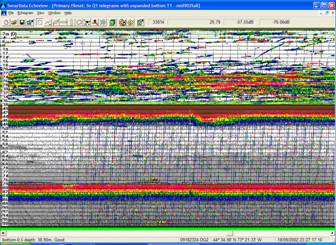
Figure 22. Acoustic cross-talk (diagonal lines throughout the water column) between 70 kHz transducer and 50 kHz on-boat depth-sounder.
Figure 23. Acoustic cross-talk between unsynchronized 70 kHz and 200 kHz survey echosounders. Arrow indicates an echo return from side lobes hitting the survey vessel.
Electrical noise
Electrical noise can be of many types. Electrical interference caused by improper grounding or other electrical systems can cause low-level voltage interference, spikes, or cyclical interference. There is also some internal noise generated by the electronics in the echosounders themselves. A low level voltage introduced to the echosounder will be amplified with range by the TVG function, and pose a problem mainly in the deeper parts of the survey area. Hydraulic pumps or winches may cause dramatic increases in noise during operation and should be checked to ensure that they do not generate noise during standby. Problems can be reduced or eliminated by:
ensuring proper grounding of the scientific echosounder;
using an uninterruptible power supply (UPS) for the scientific echosounder;
placing transducer cables and ethernet cables (between the GPT and computer) away from possible electric fields such as fluorescent lights, and;
eliminating electrical interference during data collection.
Electrical interference not eliminated during data collection (Fig. 24) should be removed during post-processing, either manually or with signal processing techniques. Manual removal of noisy regions and excluding them from the analysis should not affect results as long as these regions are relatively small. Automated techniques may be possible but probably require specialized software. If signal-processing techniques are used, care should be taken to ensure that data are not modified, or correction factors may be required. Increase in noise level with depth will be discussed below.
It is advisable to test acoustics equipment under various operational scenarios (e.g., winch operation, trawling, coffee maker turned on, galley fans, etc.) prior to the commencement of a survey. It is also good practice to test equipment after significant modifications to the vessel (e.g., winch, propeller, or generator replacement/repair). The magnitude of these noise sources can change also change with vessel speed (see below).
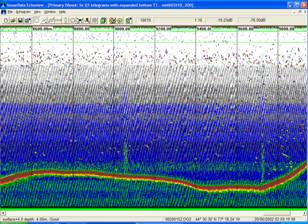
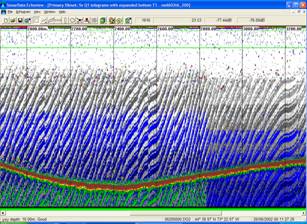
Figure 24. Two examples of electrical interference seen on a 70 kHz echosounder.
Bubble attenuation
Bubbles can have a strong effect on propagation and transmission of sound. Due to the high acoustic impedance between air and water, bubbles are efficient scatterers of sound. Bubbles can increase attenuation (loss of signal strength) and potentially increase the probability of misclassification of gas-bearing organisms.
Bubbles near the sea surface are generally associated with increased sea state and/or the position of the transducer relative to the vessel’s hull. The transducer location on the hull must be chosen to minimize potential problems caused by bubbles. To prevent degradation of survey data, it is necessary to slow vessel speed or suspend acoustic survey operations when sea state causes unacceptable bubble attenuation. Bubble backscattering can be removed from data during post-processing by removing a portion of the data near the transducer face, but this will not correct signal loss from targets of interest.
Propeller cavitation
Low-pressure areas are created around vessel propeller blades as water accelerates and moves past the blade surfaces. Faster propellers create lower pressure regions than slower propellers. The formation of small gas bubbles, resulting from water reaching vapor pressure, is called cavitation. The noise that is detected on acoustic systems results from the sudden collapse of these bubbles. In addition to causing detectible noise, cavitation can also degrade propeller blade surfaces, thus increasing the amount of noise generated. Cavitation can be caused by propeller design or by flow patterns resulting from vessel design (e.g., hull shape).
Propellers should be visually inspected prior to a survey to ensure that blades are not damaged. If cavitation is a suspected problem, replacement of the propeller or modification of the vessel hull may reduce the problem.
Other vessel noise
Vessel engines and gearboxes may also generate noise that is detected by the echosounder (reviewed by Mitson and Knudsen 2003). Depending on vessel design, engines and gearboxes may cause the hull to vibrate and generate pressure waves. Vibrations will cause an increase in noise, particularly in shallow water with hard bottoms. Additionally, gearboxes are known to “whine” at frequencies that may be audible to acoustics.
Side lobes
When a transducer is mounted on a shallow-towed body or pole mount, it is possible to receive backscatter from side lobes hitting the vessel hull. When this occurs, a solid band of backscatter at a distance from the surface is visible on the echogram (Fig. 23). Deep-hulled vessels exacerbate this condition.
The effect of side lobes hitting the vessel can be remediated by:
- deploying the towed body deeper, or;
- hull-mounting the transducer.
Deeper deployment, whether on a towed body or the vessel hull, can result in a loss of near-surface data. Regions with vessel echoes should be removed from analysis.
Degradation
Biofouling
Bio-fouling results from the accumulation of biological material (e.g., algae, small invertebrates) on the face of the transducer, causing a systematic degradation in echosounder performance as the bio-fouling increases.
Bio-fouling can occur on hull-mounted transducers or protective coverings that stay in the water for long periods of time. Accumulation of material on the transducer will reduce the transmitted and received sensitivity, and this reduction may not be recognized by system performance procedures, although it should be detected by calibration. Hull-mounted transducers and protective coverings should be checked and cleaned regularly, and at a minimum before each field season. This is less of a problem for towed bodies and pole deployment.
Cable breaks
Transducers mounted on towed bodies are most susceptible to cable breaks given the distance between transceiver and transducer. Cable breaks may occur during storage, transport, or survey. Depending on the break, specific quadrants within a split beam transducer may be lost or a periodic loss of signal may be detected. The breaching of transducer cable housing is also of concern. Once water penetrates the cable and moves into the transducer, the transducer is irreparable.
Improper towed body weighting
Data quality can be degraded by improper towed body weighting (Fig. 25). Improper weighting can result from:
sub optimal speed (too high or too low);
towed body placement within hull wake;
transducer placement on the towed body, or;
improper counterbalance weighting of the towed body.
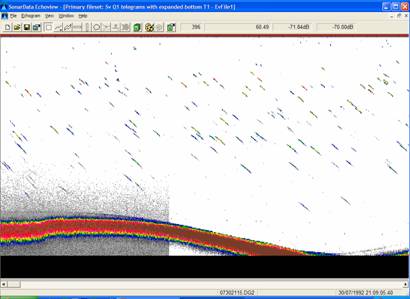
Figure 25. Improper towed body weighting, resulting in highly angled fish targets. Also note the change in noise levels in the middle of the echogram.
The effects of this problem include inaccurate bottom depth and target depth measurements and possible lost data pings. A tilted transducer also causes the fish to be tilted relative to the transducer. This will result in differences in TS between surveys making identification of TS distributions difficult. Sv values will be biased relative to theoretical TS measurements for the size of fish sampled. This is less of a problem if using in situ TS measurements but be aware that the TS distributions will be affected by the resulting tilt angle of the fish relative to the transducer. Comparisons of TS distributions between years and regions of the lake may be affected.
Towed body weighting can be diagnosed by direct observation and inspection of the echogram. It is advisable to conduct trials on towed body placement and vessel speed prior to the commencement of a survey.
Diagnosis of system performance
Echosounder manufacturers should provide detailed diagnostic and evaluation routines. General diagnoses for the EK500 are:
Test data
A ‘test’ value for Simrad transducers measures transducer performance through an internal oscillator routine. Test values should be checked at the beginning of each survey day. This feature is not available on the Biosonics units.
A ‘test’ value outside the specified tolerance (-55 ± 2 dB for Simrad split beam, -61 ± 2 dB for Simrad single beam transducers) is an indication of:
a broken connection in one or more of the wires to the transducer, or;
a faulty transceiver board
However, it is changes in the test values relative to values when the system was working properly that are important. The specified tolerance limit of ± 2 dB may be too broad to detect problems. A change from -55.5 dB to -53.5 dB indicated a cable break in the Cornell Simrad EY500 unit.
If the ‘test’ signal is changing and/or outside of tolerance values:
check all transducer connections;
measure transducer impedance (should be 60 Ω), and;
measure transducer impedance while moving sections of the transducer cable to detect any weak sections.
The cause of an unacceptable test signal should be determined and rectified. If connections and transducer impedance are not the problem, then a full set of diagnostics must be completed on the echosounder to determine the cause of the problem. The survey should not continue until the problem is rectified. If individual targets do not appear in all quadrants, survey operations should be suspended and the problem diagnosed (NMFS SOP).
Passive data
When a transducer is switched to “passive” mode, it listens but does not transmit (Fig. 26). This function allows the user to measure ambient background noise or to determine the source of detected noise. Passive mode should be used prior to the commencement of a survey to determine whether vessel noise levels are acceptable. In general, stationary noise levels of -140 dB (TS domain) or less are attainable with proper grounding.
Procedures for the collection of vessel noise data are available from the manufacturers. Recommendations from Mitson (1995) and Simrad suggest that passive data should be collected under the following conditions:
vessel stationary and running
incrementally increasing the vessel to survey speed
vessel running at survey speed
incrementally decreasing the vessel to stationary
towing trawls (midwater and/or bottom) to be used during the survey
If increasing noise is observed with increasing speed, and vice versa with decreasing speed, the propeller is causing the noise. It is then also advisable to collect passive data under different pitch and propeller speeds. A minimum of 2-5 minutes of passive noise collection under each condition/speed is recommended.
By using the echogram color scheme, the user may evaluate whether noise levels will mask the targets of interest (Example 7).
Passive Data Monitoring Example, taken from Simrad EK60 Manual.
If the desired lower Sv limit is -70 dB, and a Signal-to-Noise Ratio (SNR) of 10 dB is required, set the minimum color scale for the 20logR TVG to -80 dB. The point at which shading in the echogram (e.g., gray) begins is the depth at which the Sv limit is obtained with the 10 dB SNR.
The same can be done using the 40logR TVG echogram for TSu.
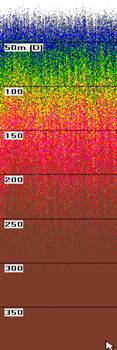
Figure 26. Passive data collected with 120 kHz echosounder, showing increases in noise with depth. Lower threshold is -90 dB.
Noise levels at 1 m (Sv at 1 m) observed during survey conditions should be recorded and reported in papers that utilize the survey data. Note that noise level measured in the TS domain is not the same as noise levels in the Sv domain (Equation [24] above).