Higher frequencies have short wavelengths (λ) and therefore can discern smaller targets than lower frequencies (Table 2). Scientific echosounders operate in the range where target length (L) is larger than the wavelength (λ), thus in the geometric scattering region (L >> λ). When the wavelength is larger than the target (λ > L, the Rayleigh scattering region), very little sound is reflected and the echo is weak (Simmonds and MacLennan 2005). Smaller targets achieve geometric scattering at higher frequencies. But this is not always desirable, as invertebrates can contribute substantially to Sv at high frequencies.
Table 2. Calculation of λ for common fisheries acoustic frequencies in freshwater at a sound speed of 1450 m•s-1.
Frequency (kHz) |
λ (cm) |
Absorption
(α,dB•km-1) |
38 |
3.82 |
0.45 |
70 |
2.07 |
1.52 |
120 |
1.21 |
4.47 |
200 |
0.72 |
12.41 |
420 |
0.34 |
54.72 |
Higher frequencies have higher absorption (α) and therefore reduced ranges for observing targets (Table 2, Fig. 2). This would suggest intermediate or lower frequencies are appropriate choices, particularly for deep-water applications.
Figure 2. Loss of acoustic signal strength (dB) due to absorption for common acoustic frequencies.
Organisms must be sufficiently separated to be identified as individual targets to obtain valid TS measurements. Pulse duration (t, s) and sound speed (c, m•s-1) affect the separation of echoes through the relationship:
 |
|
[18] |
where ∆R is the range between two resolvable targets (R1 and R2, m). Targets that are closer together than ∆R cannot be separated (Simmonds and MacLennan 2005). Although frequency is not a factor in the calculation of acoustic resolution, higher frequencies can generally operate at shorter pulse durations (e.g., 0.2-0.3 ms), thus allowing the resolution of targets closer together.
Fish TS is more variable at higher frequencies because the effects of tilt and roll (aspect) are larger (Fig. 3). Higher variability makes it more difficult to identify species or age-groups in the TS distributions and detection thresholds become more variable. This suggests lower frequencies to be a better choice for fisheries surveys.
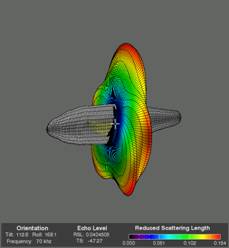
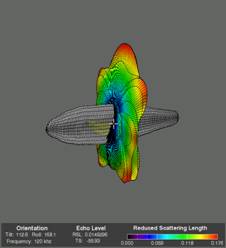
Figure 3. Expected TS of an alewife calculated using the Kirchhoff-Ray mode model at 70 kHz (left panel) and 120 kHz (right panel). Details in Horne and Jech (2005).
Due to non-linear effects (i.e., harmonic distortion), maximum input power is limited for transducer frequencies at or higher than 120 kHz (Tichy et al. 2003). However, reduced input power results in a lower SNR at depth and a decrease in target detection probability. For 120 kHz, we suggest limiting the power output to less than 300 W. For higher frequencies, use lower power output.
The higher the frequency, the smaller the physical size of the transducer (Fig. 4). This consideration is important for most transducer deployment options (Fig. 8-10).
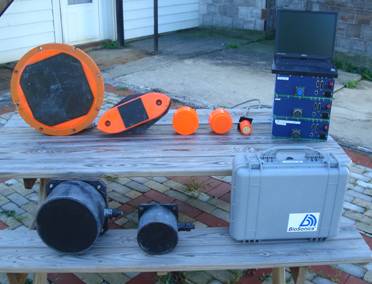
Figure 4. Variation in transducer size. Top row (L to R): Simrad 38 kHz – 7o, 70 kHz – 11o , 120 kHz – 7o, 200 kHz - 7o, and 710 kHz - 6o. Bottom row (L to R): Biosonics 120 kHz - 7o and 430 kHz - 6o.
The most common frequency used in the Great Lakes is 120 kHz. This frequency has a wavelength of 1.2 cm, can operate with short pulse lengths (0.2 to 0.6 ms are common), and has relatively low absorption (around 5 dB•km-1 in freshwater, Table 2). This intermediate frequency is available from several manufacturers. Unfortunately, mysids shrimps give rise to relatively strong echoes at 120 kHz (Rudstam et al. 2008). 70 kHz is another possible intermediate frequency that will produce less mysid reverberation. In general, higher frequencies (>200 kHz) are less appropriate for fisheries acoustics in the Great Lakes because of higher absorption rates and higher reverberation from invertebrates. Note the higher Sv values for mysids at higher frequencies in Fig. 5. Also note that depth penetration is less at higher frequencies as a result of higher absorption at higher frequencies. Lower frequencies, like 38 kHz, have not yet been used in the Great Lakes due to the large physical sizes of the transducer and because a 120 kHz sound pulse can reach the bottom in most Great Lakes survey areas. Also, the 38 kHz has a larger near-field due to the larger size of the transducer. However, 38 kHz has low noise levels and low backscatter from invertebrates and may therefore be better for assessing fish abundance than a 120 kHz unit. Different frequencies do accentuate different targets (Fig. 5).
Figure 5. Frequency-dependent scattering. Top five echograms are Sv data for 38, 120, 200, and 710 kHz Simrad EY60 and a 430 kHz Biosonics Dt-X units. The two higher frequencies are single-beam units, the three lower are split-beam. Data was collected while stationary in Cayuga Lake, New York in September 2006. Most fish are alewife. The backscattering below the thermocline (arrow) is from Mysis relicta. All units except the 430 kHz were mounted on the same tow body. The large fish below the thermocline is therefore not present on the 430 kHz. Lower threshold in all top echograms are -80 dB. Bottom depth is 86 m. Noise has not been removed to illustrate the increase in noise levels at depth at higher frequencies. Derived from Rudstam et al. (in prep).